Here is a graphic that captures the relationship of the Theory of Regulatory Compliance, Key Indicators, Risk Assessment, and the dichotomization of licensing data (all these topics have been discussed at great length in the RIKINotes Blog over the past year):
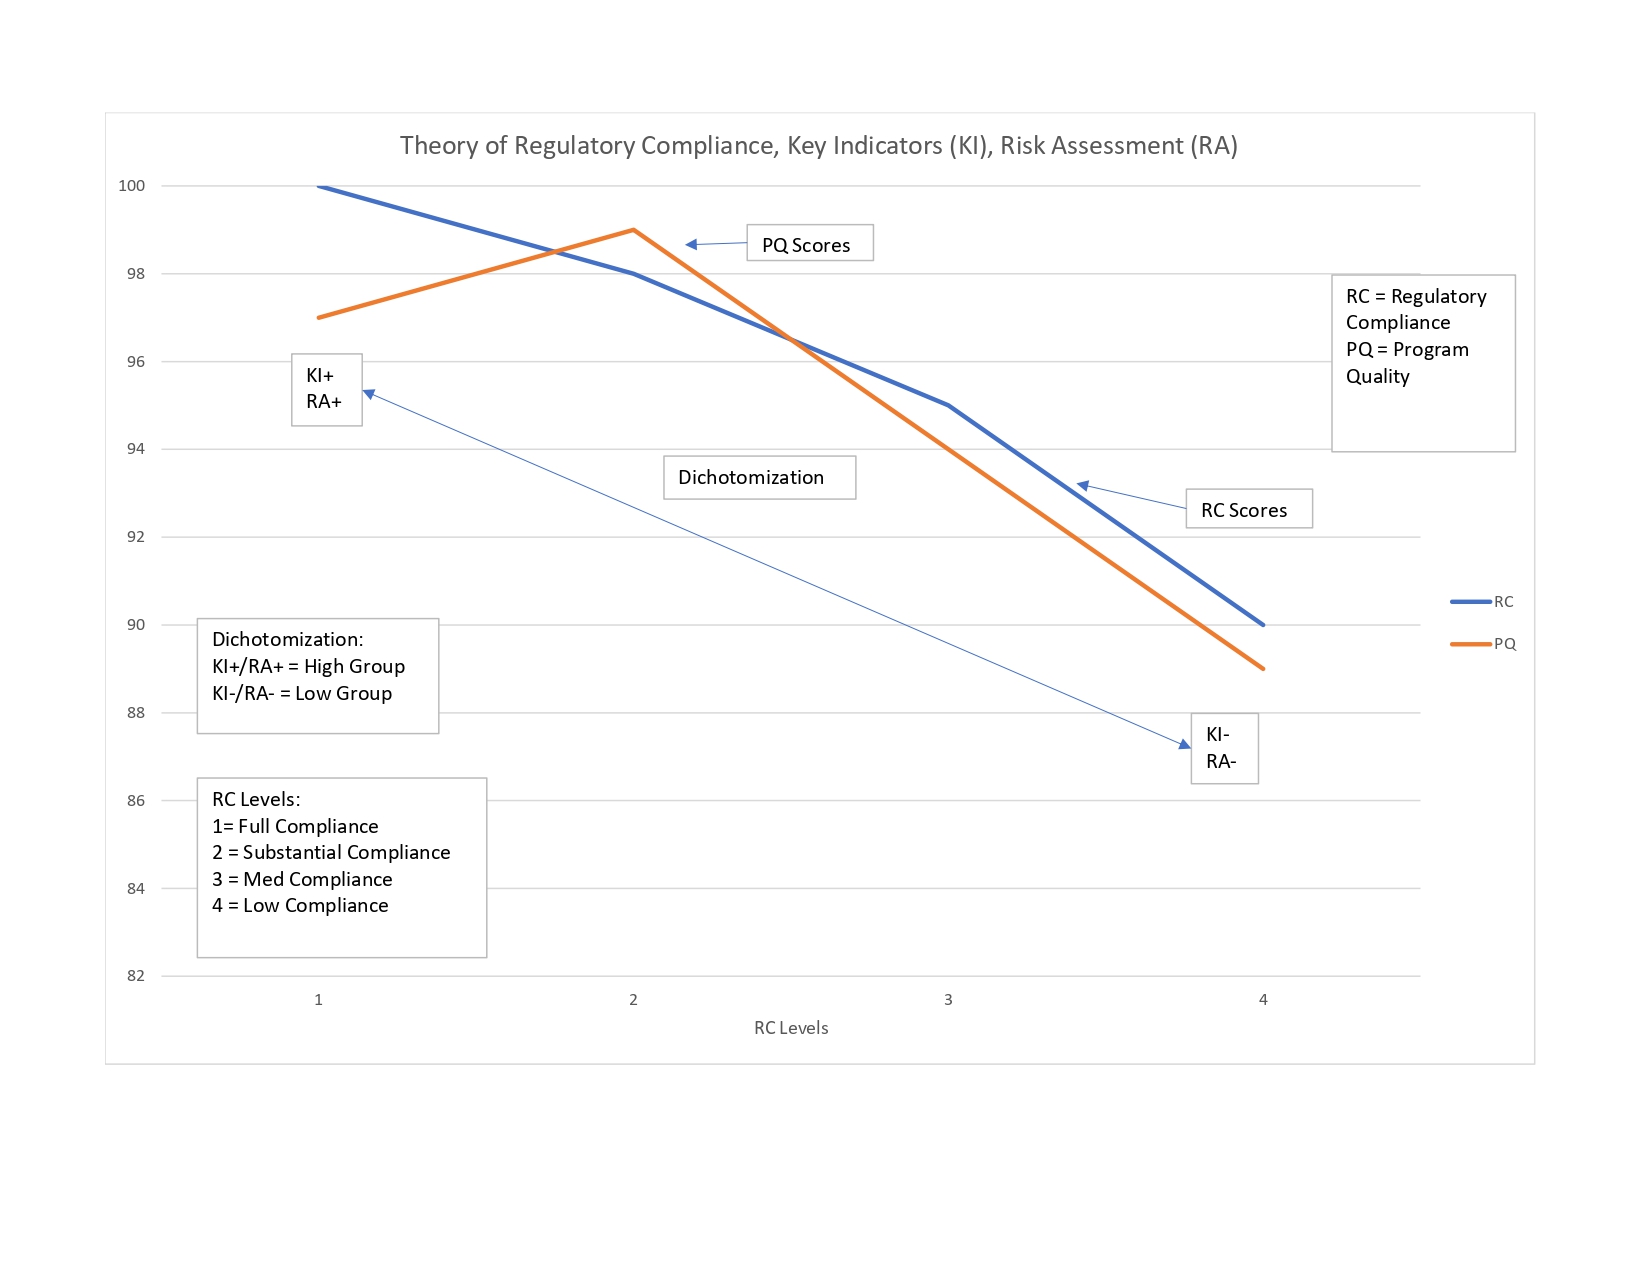
A picture is worth a 1000 words, but in the above case, I am sure a couple of words of explanation would be helpful for those who are left hemisphere dominated rather than right hemisphere dominated as I am. Here are the essential elements of the above graphic.
RA = Risk Assessment rules insures that all the high risk rules are in compliance. This is non-negotiable, all of them are in place for any type of inspection review: full, comprehensive and/or abbreviated. KI = Key Indicators are a bit more flexible because it is based upon probabilities and the predictor rules are generally not as heavily weighted as is the case with risk assessment rules.
The bottom line is that regulatory compliance is important in ensuring that clients are safe and healthy. However, the relationship with quality is a bit more complex based upon the Theory of Regulatory Compliance. There is not the same relationship to program quality as there is to health & safety. Substantial compliance appears to be more effective in determining overall program quality rather than full regulatory compliance with all rules. That is depicted in the curvilinear relationship between Regulatory Compliance (RC) and Program Quality (PQ) as one moves along the RC Levels (1 – 4 = Full – Low Compliance).
And finally, data dichotomization helps to eliminate false negatives and decrease the impact of false positives when taken to the extremes (moving from a 25/50/25 model to 5/90/5 model in distinguishing between high and low regulatory compliance (KI+/RA+ & KI-/RA-)). The rules will not change usually but their phi coefficients will increase significantly. Data dichotomization is not generally recommended but with the extreme skewness in licensing data it is warranted and fits with the measurement of licensing data at the nominal level as well as the theoretical structure of the data distribution based upon full and substantial levels of regulatory compliance being the predominant number of programs. There generally are far fewer programs at a medium or low level of regulatory compliance.
The above graphic helps to summarize several concepts related to differential monitoring and the theory of regulatory compliance. It is suggested that previous RIKINotes posts and the RIKI Selected Publications webpage be consulted for a more detailed rendition of what is presented in this post. The technical research notes on the RIKI Selected Publications provide a more in-depth analysis of the above concepts.

Leave a comment